Players often ask: "I shoot 45% on twos and 30% on threes. Which one is better for me?" The surprising answer is that they are equal. A percentage alone can't settle the comparison, because a three is worth three points and a two is worth two.
We showed how eFG% captures this in the difference between the three percentages. Here we boil the idea down to one step, then apply it to the 15 court zones you log on in ShootingStat.
Worked example
The idea in two lines:
- Points per attempt = percentage × the shot's value (2 or 3).
- For a three to match your twos: two-point percentage ÷ 1.5.
The three-point percentage that matches each two-point percentage.
01Your points per attempt
Let's turn the percentage into a more useful number: the points you score on average from each attempt.
Formula
Points per attempt = percentage × shot value
If you make 50% of your twos, you score 0.50 × 2 = 1.00 points per attempt. If you make 33.3% of your threes, you score 0.333 × 3 = 1.00. Both give you about one point per attempt, even though one percentage is far lower than the other.
02The break-even point
This leads to the rule. A three is worth one and a half times a two (3 ÷ 2 = 1.5), so it needs a percentage lower by that factor:
Formula
Break-even three-point % = two-point % ÷ 1.5
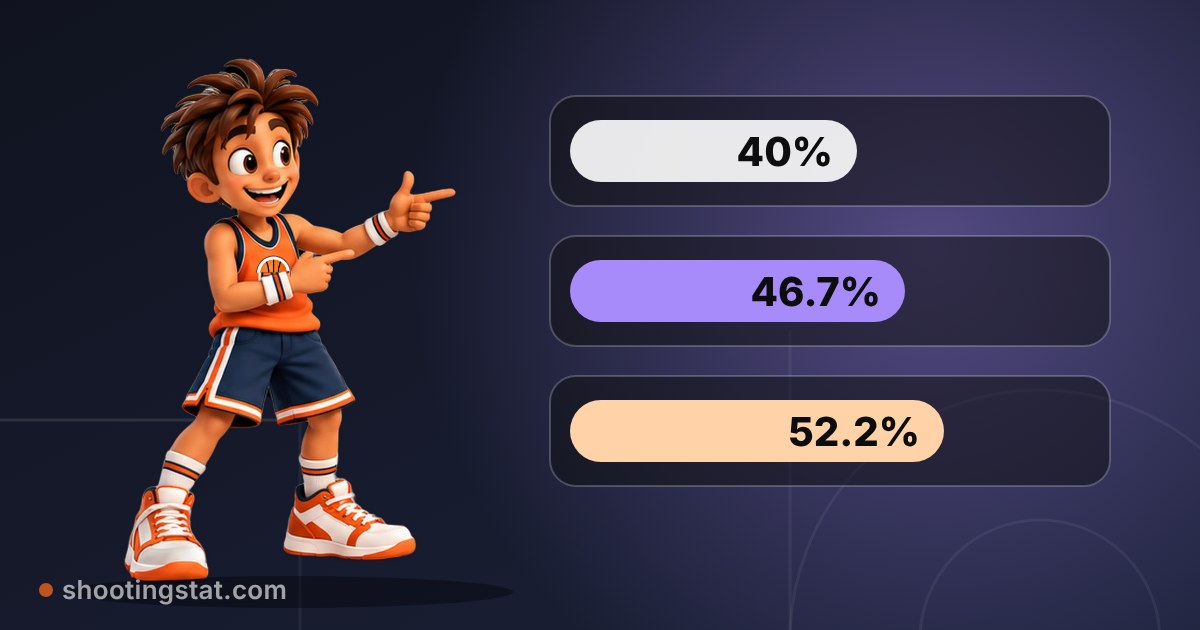
From 50% on twos, the match is 50 ÷ 1.5 = 33.3% on threes. From 45%, it is 45 ÷ 1.5 = 30%, which answers the question at the top. You will find the other cases in the figure above.
03Applying it to the court
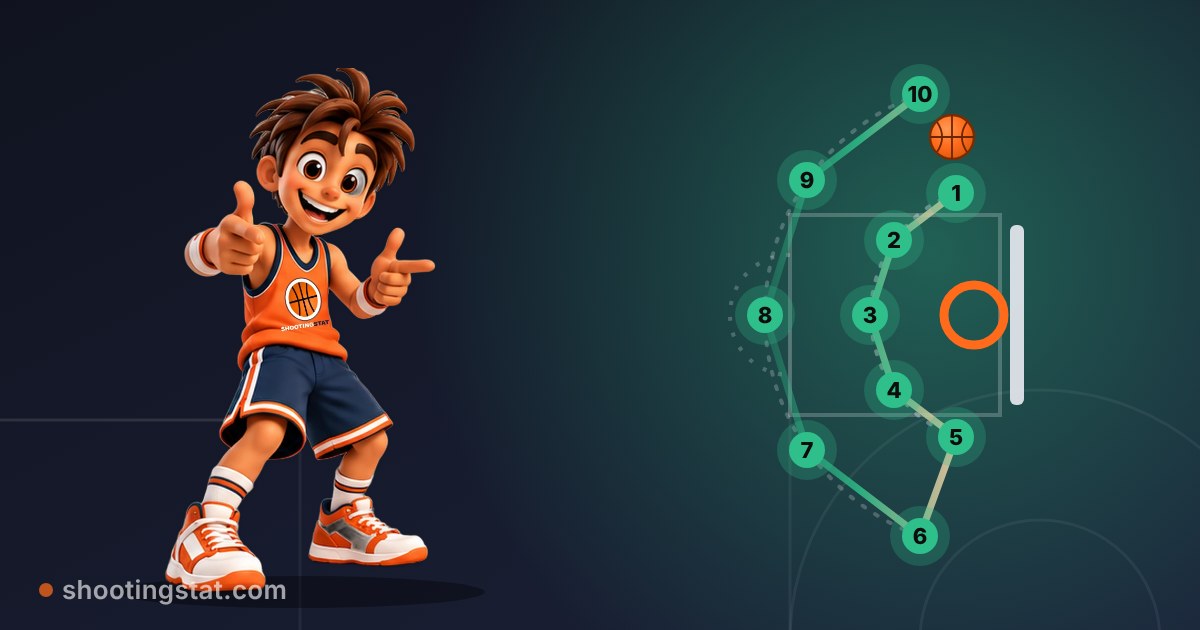
ShootingStat divides the court into 15 zones: zones 1 to 5 are close to the basket, 6 to 10 are mid-range, and 11 to 15 are threes. When you log on the court map, it shows you each zone's percentage and number of attempts.
The table below is an illustrative example with numbers we made up, not a real player's. It calculates points per attempt for five zones, with 20 attempts from each:
Zone
Makes out of 20
Percentage
Points per attempt
Restricted / Rim (1)
14
70%
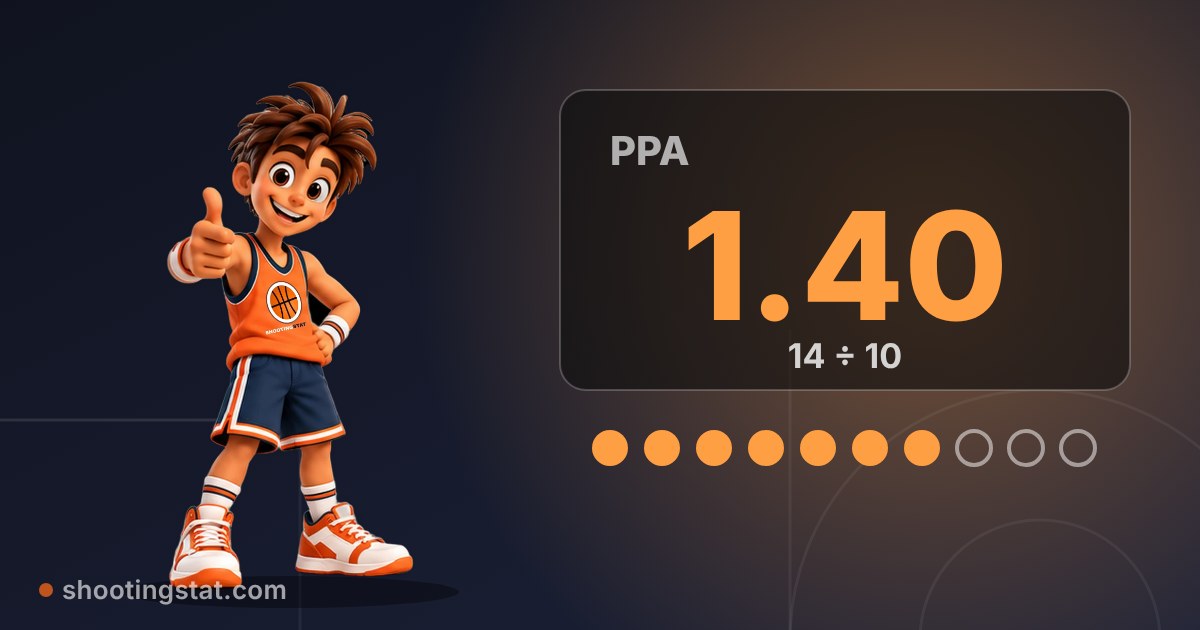
1.40
Left Corner Three (11)
8
40%
1.20
Left Wing Mid-Range (8)
9
45%
0.90
Left Wing Three (13)
6
30%
0.90
Top of the Key Three (15)
5
25%
0.75
Here is what the table tells us:
The zone with the highest return is at the rim, even though a shot from there is worth only two points.
The corner three at 40% earns more points than the wing mid-range at 45%, so the higher percentage is not always the better one.
The wing mid-range and the wing three are equal at 0.90, as we calculated a moment ago.
The zone with the lowest return is the three from the top of the key.
Our suggestion is to give extra practice time to a zone that returns few points and that you use often in games, not simply to the zone with the lowest percentage.
04Before you decide anything from the numbers
Common mistake
Three notes to protect you from jumping to conclusions:
The sample is small. With 20 attempts, one shot moves the percentage by 5 points. An analysis of seven NBA seasons (published by FanSided in 2014) estimated that three-point percentage only becomes half skill and half luck after about 750 attempts. That is an approximation, and it agrees with other research that ranks three-point percentage among the least stable measures in basketball. One zone in one week is not enough for a final verdict.
Shot quality changes the math. In an analysis of NBA data (c. 2018), a wide-open two from about 20 feet averaged 0.84 points, while a three with a defender close by averaged about 0.71. So a three is not always better. These are professional players' numbers, so take them as an illustration of the idea, not a benchmark for you.
For young players. We suggest putting sound technique first. Don't push a young player into threes that force them to change the shape of their shot just to reach the basket, because the decision is not only a mathematical one.
05How to work it out from ShootingStat
Log your sessions on the court map, so you get each zone's percentage and attempts.
Take the percentages of the two zones you want to compare.
Read each zone's points per attempt (PPA) in the zones tab. To check it by hand, multiply the percentage by 2 for zones 1 to 10, and by 3 for zones 11 to 15.
Repeat the comparison after several sessions, not just one.
The zones tab shows each zone's makes, attempts, percentage and PPA, and picks out your best and weakest zones. A zone's ranking appears once you log 10 or more attempts from it.
06Summary
A percentage alone can't settle the comparison. Compare your points per attempt.
For a three to match your twos, divide your two-point percentage by 1.5.
The zone with the higher percentage can give you fewer points than a zone with a lower one.
Don't build a decision on a few attempts, and watch shot quality.
This week, pick two zones from your map and work out the points per attempt for each.
FAQ
Is a three always better than a two?
No. It depends on your percentage from each and on shot quality. A three needs a lower percentage to match a two, but a three with a defender close by can be worse than an open two.
What three-point percentage matches 50% on twos?
About 33.3%. A made three is worth three points, and 33.3% gives you one point per attempt, the same as 50% on twos.
How many attempts do I need from a zone before I can trust the percentage?
There is no fixed number, but a handful is not enough. With 20 attempts, one shot moves the percentage by 5 points. ShootingStat does not label a zone hot or cold before 10 attempts, which is a minimum, not a sign the percentage has settled. Follow the zone across several sessions.
What about free throws?
A free throw is worth one point, so your points per attempt equal your free-throw percentage. But free throws don't come from a spot you choose, so they stay out of the zone comparison. You will find them in TS%, as we explained in the article on the three percentages.